Published on Darwin Day, February 12, 2023
AWESOME
I. Tribute
II. Science
III. Probability Distributions: The Best Way to Say, “I Don’t Know”
IV. Statistics
V. Conclusions
I. Tribute
II. Science
A. Dichotomies
A. Dichotomies
“True or False?”
It seems like such a simple question! But framing the world in terms of objectively “true” and “false” facts is a relatively recent concept. Veracity is the framework of science.
We can be trained to follow the scientific method, but it doesn’t come naturally. It’s not what our brains and minds evolved to do. We are instead endowed with a politico-religious instinct. Our gut feeling is to describe the world in terms of dichotomies like:
| “Us” | “Them” | |
| ↓ | ↓ | |
| “Good” | “Bad” | |
| ↓ | ↓ | |
| “Right” | “Wrong” |
The politico-religious instinct must surely be as old as language itself. By contrast, I don’t see clear evidence of logic or science before the 1st millennium BC.
These are examples of politico-religious choices:
Can I trust you?
Is it good or bad to kill your neighbor?
Is it good or bad to kill an uninvited foreigner?
Is it right or wrong to believe in global warming?
To be sure, the underlying question, “Is the globe warming?” is a scientific question. But layered on top of this is the unstated political question, “Is it right or wrong to believe it?” In other words, “What does my culture want me to believe?” A Gen-Z Scandinavian responds to an entirely different peer pressure than a Baby Boomer American or a Chinese bureaucrat. Even matters of the earth and sun can be socio-politico-religious.
B. Evidence and Logic
Science is often defined as reasoning based on evidence. There’s a little more to it than that. Politico-religious arguments usually support themselves with plenty of evidence too. The difference is in how the evidence is selected and weighed. When someone attaches the “true or false” dichotomy to the “good or bad” dichotomies, he gets emotionally attached to facts, and he can’t evaluate them fairly. He “filters” the evidence (see next figure). If he likes evidence, he accepts it at face value. When he confronts evidence that he doesn’t like, though, he makes up myriad clever excuses to ignore it. 1 Evidence filtering ranges from the childish (“You can’t believe anything they say”) to the surprisingly sophisticated. Suddenly, everyone becomes an expert at sampling techniques and Bonferroni analysis when it comes time to refute “bad” evidence.
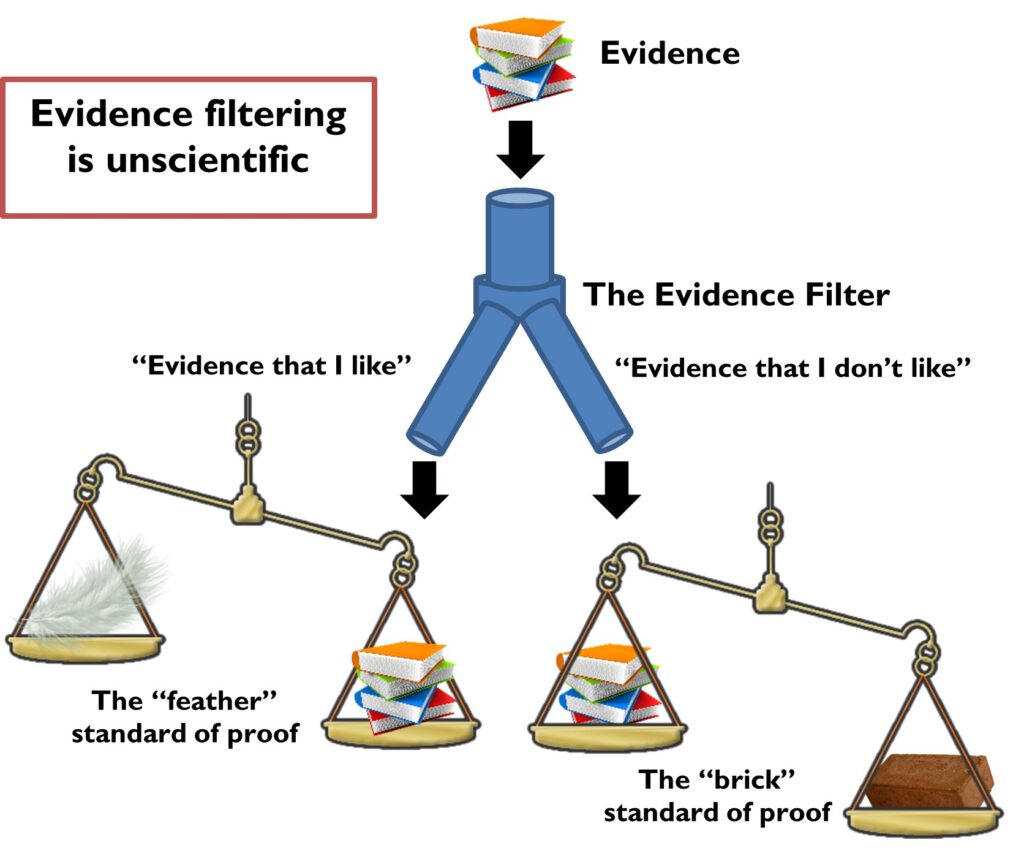
Science, then, doesn’t just mean “evidence.” It means an honest consideration of all the evidence and only the evidence. We can only do this if we don’t get emotionally attached to hypotheses or conclusions. Therefore, science must be divorced from dogma. If we start out with the premise that a certain fact must be true because it’s good to believe that way, we will never get closer to the truth. Science presents hypotheses that can be proven wrong. Scientific thinkers allow evidence to change their mind about beliefs. They don’t let their beliefs change their mind about the evidence.
Science must also pursue proper logic. Logic presents the mental rules of the game, the thought process from premises to conclusions. If experiments have established that “A” is true and “If A, then B” is true, logic gives us a handy shortcut to “B is true” without further experimentation. If experiments have shown that “If A, then B” is true but “A” is false, a good scientist will conclude that B is unknown. An unscientific thinker might try to fool us (and herself) into concluding that B is false.
Let’s put the pieces of this puzzle together in an example with modern relevance. What do we do with an inconsistent set of beliefs or facts like the following?
- The bible is infallible
- The bible tells us that God made the world in six days, 6,000 years ago
- Modern scientific techniques have dated the world as billions of years old
An honest, scientific assessment of these facts would lead us to two inescapable conclusions:
- Either the biblical account of Earth’s creation is false, or modern scientific techniques of dating the world are in error (let’s double check for good measure).
- If the biblical account of Earth’s creation is false, then the bible is fallible.
Geologists were initially shocked by evidence that the earth might be astronomically old. Now they have been double-checking their instruments, observations, data, scientific principles, and mathematics for centuries. It’s getting pretty hard to honestly escape the conclusion that the world is billions of years old. 2
For a dogmatically religious person, though, the only emotionally permissible conclusion is:
- “The bible is infallible” must be true because it’s the “right” belief for “us” to have.
- Therefore, the world must be 6,000 years old.
- Consequently, scientists are either mistaken or lying. Either they’re hopelessly inept at telling right from wrong, or they have an evil agenda. 1 3
From this perspective, science looks like just another religion. After scientific inquiries contradicted a few sacred beliefs last millennium, unfortunately, some religious communities took to villainizing the whole house of science. That resentment is still central to today’s cultural divide.
C. Falsifiability
The instinctive way to bolster a belief is to gather circumstantial evidence: facts that are consistent with your belief being true. For example, why did you believe in Santa Claus as a child?
Exhibit A: My parents told me that Santa Claus comes for Christmas.
Exhibit B: There are toys in the living room on Christmas morning.
Exhibit C: I saw Santa Claus at the mall.
Sure, if Santa Claus were real, every one of these facts would follow naturally. But the converse is not true. Exhibit B does not prove that Santa exists, because there’s another explanation for Christmas toys in the living room. By gathering such exhibits, we only keep reiterating the notion that Santa could be real. We can’t prove that Santa must be real, even with a million self-consistent observations.
With just one well-chosen fact, though, we can cast serious doubts on Santa’s existence. We can “falsify” it. Merely considering the number of households that Santa must visit worldwide in one day, his plausibility gets stretched incredibly thin.
To qualify as scientific, a hypothesis should be falsifiable. 4 That is, it must be vulnerable to countervailing evidence if it is false. The claim, “Santa Claus lives at the North Pole” was essentially non-falsifiable before 1900, when the North Pole was humanly inaccessible. 20th century technology made the claim falsifiable. The claim was then actually falsified when Arctic explorers found the North Pole bereft of elves and gingerbread houses. However, it could be re-non-falsified by a claim like, “You can only see Santa Claus if you believe in him!” Non-falsification is one of the most popular forms of evidence filtering. It gives us leeway to believe whatever we want. This is a major reason that religion and conspiracism inevitably drift toward invisible spirits or secret coverups.
III. Probability Distributions: The Best Way to say “I Don’t Know”
Probability is a bridge between science and statistics. It allows us to speak about nuances of truth and degrees of uncertainty. Probability can be difficult to grasp, but it is an essential ingredient of AWESOME thought.
Let’s remodel the true / false dichotomy as a spectrum from 0% to 100% probability. Suppose your wife asks you, “Did you turn the lights off before we left?” and you don’t remember. You could just say, “I don’t know.” That statement conveys no information at all about the state of the lights. But if you’re feeling fairly confident that you did, you could say, “I feel 75% certain that I turned the lights off.” It feels strange to describe a binary value with a continuous range of numbers. This can be very useful in science, though, where almost nothing is ever known with 100% certainty. Furthermore, if you come home and find that the lights are still on, your statement is still valid! You’d expect the lights to be on about one time out of every four return trips home. (If it happened more often than that, you’d better revise your 75% estimate).
Now let’s go one step further and answer a question with numerous possibilities: “How many lights did you leave on?” Again, “I don’t know” is the least informative answer you can give. You can do better by enumerating all the possibilities: “There are five lights in the house, so the number of lights that I left on is either 0, 1, 2, 3, 4, or 5.” Then you can assign a likelihood to each one of these. “The likelihood that I left 0 lights on is 10%. For 1 light, it’s 20%, 30% for 2 lights, 20% for 3 lights, 15% for 4 lights, and 5% for 5 lights.” Although your wife might slap you at this point, you have given her the most useful, informative version of “I don’t know.” This description is called a probability distribution. We can represent it as a table or a graph.
| # of lights | Probability |
| 0 | 10% |
| 1 | 20% |
| 2 | 30% |
| 3 | 20% |
| 4 | 15% |
| 5 | 5% |
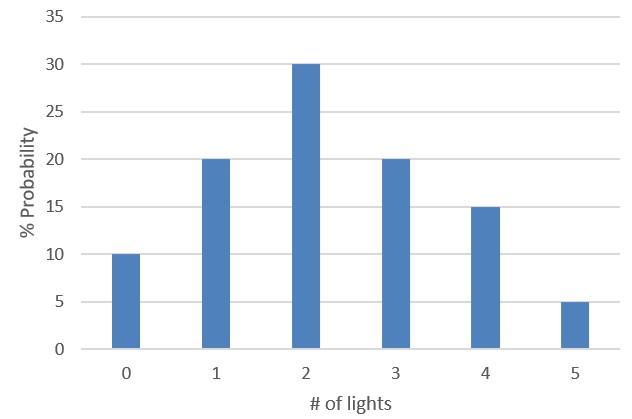
You can see that this version of the answer has a two-dimensional shape to it. The most important probability distribution is called “normal”. It is kind of a mathematical idealization of the graph above, and I’m sure you’ve seen it before:

Probabilities don’t come up often in everyday language. Not only do most people shun numbers, but we dislike getting caught without the “right” answer. We prefer the satisfaction of committing to an answer, even if we have to fight for it. Ask a group of sports fans who will win the next Superbowl, and most of them will give just one answer, vigorously defended. But the world doesn’t work according to how we like to feel. If we can learn to think of unknowns as probability distributions, it gives us much more flexibility, accuracy, and descriptive power.
Give doubt a chance!
IV. Statistics
B. Individuals, Samples, and Populations
A. Beyond Personal Experience
If you ask any single person how the world works, you’ll get a very narrow answer. His view of the world is limited to what he has personally seen and how he has interpreted it. Maybe it’s better to survey large groups of people, since a collective has broader personal experience than an individual. But then you’ll get mythologies and superstitions. Some communities will describe a king-like god while others will talk of astrology, animal spirits, or the Illuminati. We believe and repeat what our neighbors say.
Statistics is a modern system for perceiving and interpreting the world at large. It involves the collection of data, or numerous random observations. Because these observations are numerous and random, they go well beyond what any one person can directly experience. Data is then analyzed within a precise probabilistic framework. Statistical analysis can reveal patterns that we cannot ascertain from our day-to-day lives.
The classic statistical treatise is John Graunt’s Observations upon the Bills of Mortality (1662). 5
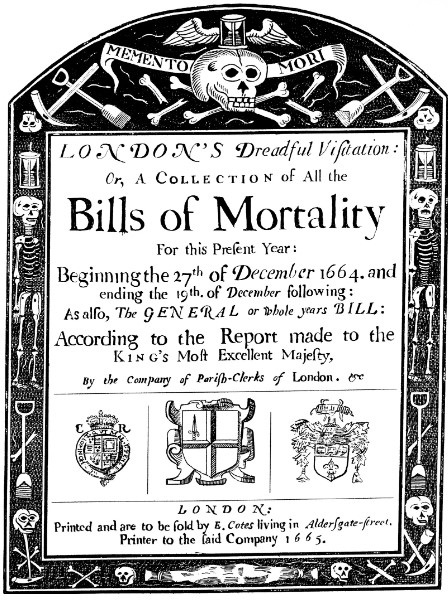 |  |
The Bills of Mortality were records of births and deaths throughout 17th-century London. Graunt pored through these bills and discovered patterns that would otherwise be indiscernible. For instance, he was easily able to construct “life tables” showing the probability that an English citizen would live to the age of 10, 20, 30, etc. He was able to debunk the superstition that plagues follow kings’ coronations. His conclusions were persuasive, not because he was highly experienced or because he quoted authority, but because he found his answers directly in the data.
Proper statistical conclusions are probabilistic. Consider a black-and-white argument presented by anti-vaxxers: “Vaccines don’t work, because you can be vaccinated and still transmit the virus.” 6 This argument might make sense in a world of binary variables (you either get vaccinated or you don’t; you either get COVID or you don’t) but it completely ignores that second dimension of probabilities. Compared to fully vaccinated people, unvaccinated people are four times as likely to become hospitalized with COVID and 11 times as likely to die. 7 These numbers don’t just refine the argument; they properly refute the claim that the vaccines are ineffective.
B. Individuals, Samples, and Populations
“Wait a minute!” you might object. “You say that statistics transcends personal experience. But data is just one scientist taking notes on a few hundred observations. Isn’t that another form of personal experience?” A well-chosen data set, though, is contrived to go beyond what a person would encounter in ordinary life so it can penetrate an entire realm of experience in the outside world. We call the data the sample, and the part of the world that it represents is called the population. A sample can properly represent a population if it is very large, like the Bills of Mortality.
Even if it’s not particularly large, a sample can still represent its population if it is chosen randomly. If we wanted to test the efficacy of a medical treatment, we wouldn’t just go to the nearest doctor’s office and interview the patients in the waiting room. We would ideally gather a list of all people who’ve ever received the treatment, and we’d do something like select every hundredth name on the list. That is obviously hard to do, but good statisticians make their samples as random as possible.
So, what exactly can a sample teach us about the whole population? There is a proper way to state our conclusions. Let’s suppose we sampled 50 patients who had taken this treatment, and the iron in their blood increased by an average of 12.8. The simplest and most powerful conclusion to draw from this would be: “Therefore, the worldwide average will also be 12.8.” Unfortunately, this ultra-specific prediction is very unlikely to be true. (Even if the worldwide average is 12.9, this statement would miss the mark).
In order to be more certain that our conclusion is correct, we must “soften” it with some wiggle room. We might infer, “This sample makes us 95% confident that the worldwide average increase will be within 1.3 units of 12.8.” With those two parameters of uncertainty – the margin of error and the less-than-100% confidence – we can make highly reliable and meaningful predictions about the world beyond this sample! Scientists and statisticians prefer to make conservative statements that are likely to be true, rather than bold statements that are easily refuted.
What would this result tell us about one individual patient who took the treatment? Here, we have to make a subtle but important shift in the meaning of probability. In the population, probabilities are basically derived from counting people. Perhaps 16% of the patients increased their blood iron by 13.2 or more. As applied to an individual, probability now becomes a metric for credence, or what is rational to believe.
Question: “If Pauline Patient takes this treatment, how much will her blood iron increase?”
True but useless answer: “I don’t know.”
Better answer: “I am 16% certain that Pauline Patient will increase her blood iron by 13.2 or more.”
The full answer is our new friend the probability distribution, often a normal one:

When we take a sample, how do we decide what population it represents? The most prudent answer is again to be conservative – hew closely to the sample. For instance, if the 50 patients in our sample were all adult men, then the sample can only represent adult men at best. It would be out of bounds to make predictions about any population that included women or children. And if the men in the sample were all left-handed laborers of Argentinian descent, then the scope of the survey would be likewise limited (that sample was probably not selected very randomly!)
If we don’t carefully study the limitations of a scientific study, we can easily get confused about the conclusions. At the beginning of the COVID outbreak, I saw a viral meme on Facebook. In outraged language, 2 it claimed that scientists already knew that hydroxychloroquine cures COVID-19 – and now they were suppressing the truth! This was a rare meme that cited its source. It linked directly to a peer-reviewed study in a respectable medical journal. 8 When I read that article, I quickly realized that the hydroxychloroquine in that study had been administered to monkey kidney cells in petri dishes. We cannot extrapolate “hydroxychloroquine reduces coronavirus levels in monkey kidney cells cultivated in petri dishes” to “hydroxychloroquine cures COVID-19 in living humans”!
V. Conclusions
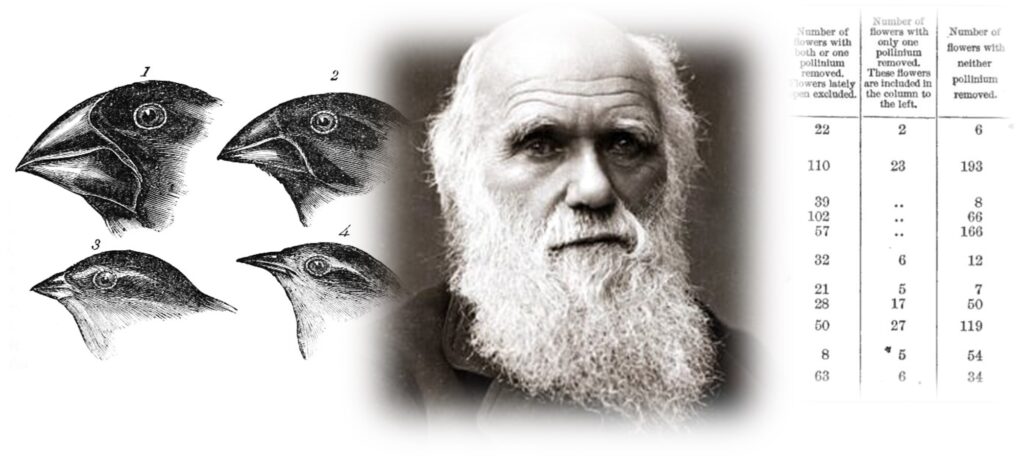
Science and statistics have gone hand in hand at least since Darwin’s time. 9 They are methods that we can use to observe the world beyond our own everyday life, to recognize patterns in what we observe, and to generalize those patterns even beyond our observations. The distinguishing characteristics of science are falsifiable predictions and an honest, unemotional assessment of evidence. Nowadays, evidence is usually statistical data.
Although science and statistics deal with questions of “true or false” (as opposed to good, bad, or culturally acceptable) it is usually unreasonable to expect 100% certainty. Probability distributions play two key roles. They measure the full diversity of populations in the real world. They also guide our beliefs when uncertainty is involved.
Criticisms of science usually reflect a failure to understand the subtleties of evidence filtering, probability distributions, sampling, and the narrow results of individual studies. A typical science critic might make a broad attack like, “First scientists told us that the world was getting colder, and now they tell us that it’s getting hotter. This just goes to show that they’re flip-flopping. You can’t believe anything they say!” 10 Science does not routinely flip-flop from one broad conclusion to another. It generally proceeds by gathering data in order to refine the shapes of probability distributions. In light of new evidence, a hypothesis might become a little likelier, or a range of possible values might narrow. If anyone ever tells you, “Scientists just proved something that will change the world” or “Everything we thought we knew has now been completely overturned,” I’d advise you to take a closer look. The results of studies are usually not nearly so grandiose. Find the source publication, see what was studied, and pinpoint the conclusions that can be conservatively drawn. Now you’re thinking like a scientist.
- What is AWESOME thought?
- Previous post: ‘E’ is for ‘Existential’
- Next post: “O” is for “Objective”
- Charles G. Lord, Lee Ross, and Mark R. Lepper, “Biased Assimilation and Attitude Polarization: The Effects of Prior Theories on Subsequently Considered Evidence”, Journal of Personality and Social Psychology 37:11 (1979), 2098-2109, https://psycnet.apa.org/record/1981-05421-001 (accessed 10/03/22). ↩
- A Short History of Nearly Everything, by Bill Bryson, presents a good history of this discovery process. ↩
- See e.g. Kent Hovind, “100 Reasons Evolution is So Stupid!”, Creation Science Evangelism (2001), unofficial copy at https://www.youtube.com/watch?v=Q8DDIe_2cHM ; or David J. Stewart, “Charles Darwin was a Massive Satanic Fraud” (Dec. 2014), http://www.jesusisprecious.org/evolution_hoax/charles_darwin.htm , which describes evolution as a “massive Illuminati scam”. ↩
- Karl Popper, The Logic of Scientific Discovery, first written in German in 1934 and translated to English in 1959, now widely in print, e.g. at http://philotextes.info/spip/IMG/pdf/popper-logic-scientific-discovery.pdf . Section 1.6 introduces the idea of “Falsifiability as a criterion of demarcation” (of science from non-science). ↩
- Public domain, accessible at https://en.wikisource.org/wiki/Natural_and_Political_Observations_Made_upon_the_Bills_of_Mortality_(Graunt_1676) (accessed 10/11/22). ↩
- See e.g. Clive Palmer quoted by Rachel Clun, “Where Clive Palmer was wrong with his COVID vaccine claims”, The Sydney Morning Herald (11/25/2021), https://www.smh.com.au/politics/federal/where-clive-palmer-was-wrong-with-his-covid-vaccine-claims-20211125-p59bzp.html (accessed, saved, and archived 10/12/22). ↩
- (In Wisconsin in July 2021). Data from Wisconsin Dep’t of Health Services, reported by Katharina Buchholz, “How COVID Affects Vaccinated and Unvaccinated People,” Statista (8/20/2021), https://www.statista.com/chart/25589/covid-19-infections-vaccinated-unvaccinated/ (accessed, saved, and archived 11/27/21). ↩
- Manli Wang et al., “Remdesivir and chloroquine effectively inhibit the recently emerged novel coronavirus (2019-nCoV) in vitro”, Cell Research 30:269-271 (2/04/2020), https://www.nature.com/articles/s41422-020-0282-0- (accessed and saved 10/12/22). ↩
- Andre Ariew, “Charles Darwin as a statistical thinker”, Studies in History and Philosophy of Science 95:215-223 (Oct. 2022), https://www.sciencedirect.com/science/article/abs/pii/S0039368122001194 (accessed and saved 10/12/22). ↩
- Doug Struck, “How the ‘Global Cooling’ Story Came to Be”, Scientific American (1/10/14), https://www.scientificamerican.com/article/how-the-global-cooling-story-came-to-be/ (accessed, saved, and archived 10/12/22). ↩